How to Calculate Solar Payback Period in India: A Working Method
Learn how to calculate solar payback period step by step, discover why self-consumption matters more than panel wattage, and read worked Chennai examples.



Two online calculators, the same 5 kW system, two answers four years apart. Neither is lying. They simply disagree about one number that most buyers never think to ask about: what a solar unit is actually worth to you.
Panel wattage barely moves your payback. How much of your own generation you consume during daylight moves it enormously, and it is the variable almost every calculator quietly assumes away.
This guide shows how to calculate solar payback period honestly. You get the simple formula, the five inputs that decide it, the realistic version that accounts for rising tariffs and ageing panels, and worked examples at both home and commercial scale in Chennai.
Key takeaways
- Simple payback is net cost divided by annual saving, and it is a fine starting point provided the two inputs are right.
- Net cost is not the quoted price. Subtract the subsidy for a home, or input tax credit and the depreciation shield for a business.
- A self-consumed unit is worth your full tariff. An exported unit is worth much less. Getting this split wrong is the single biggest source of wrong answers.
- Chennai generates about 4.8 units per kW per day across the year, or roughly 1,750 units per kW annually.
- Realistic payback is usually shorter than simple payback, because grid tariffs rise 5 to 7 percent a year and that outweighs 0.5 percent annual panel degradation.
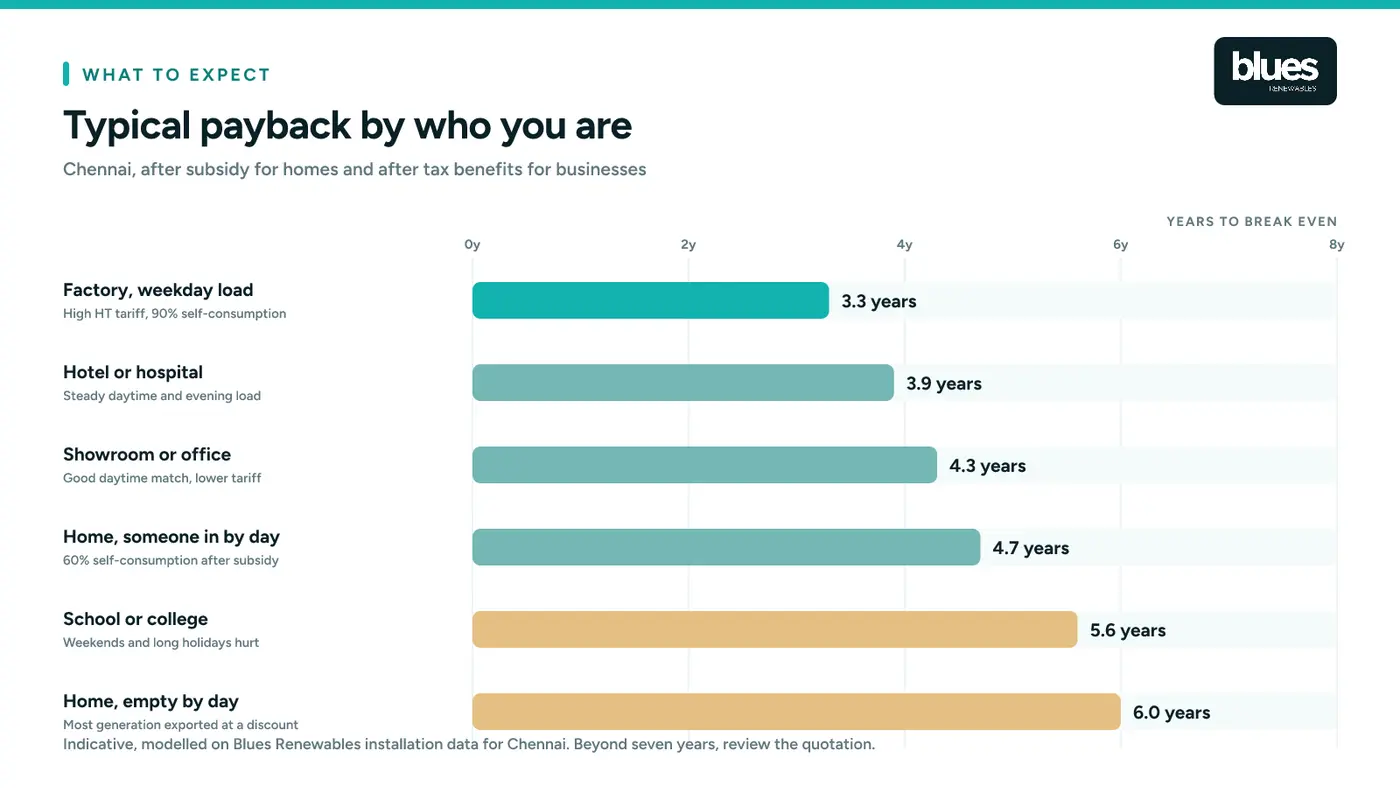
- Expect 3 to 5 years residential after subsidy, and 3 to 5 years commercial. Beyond seven years, something in the quotation deserves a second look.
Solar panel payback period: the short answer
The payback period of solar panels is the time a system takes to return what it cost you. In India in 2026 that is typically three to five years for a home after the PM Surya Ghar subsidy, and often under four years for a business on a commercial tariff with strong daytime load.
Two things move the number more than the hardware does. The first is your marginal tariff, because solar displaces your most expensive units rather than your average ones. The second is your self-consumption ratio, because a unit you use is worth the full tariff while a unit you export is worth only the credit rate. Any solar panel payback time quoted without both of those is a guess.
The method below works them out properly, then checks the answer against a realistic version.
How to calculate solar payback period
Start with the formula everyone uses, then fix its inputs.
Payback period, in years = Net system cost ÷ Annual savings
The arithmetic is trivial. The work is in the two numbers.
Step 1: Work out your net cost, not the quoted price
What you actually part with differs from the invoice.
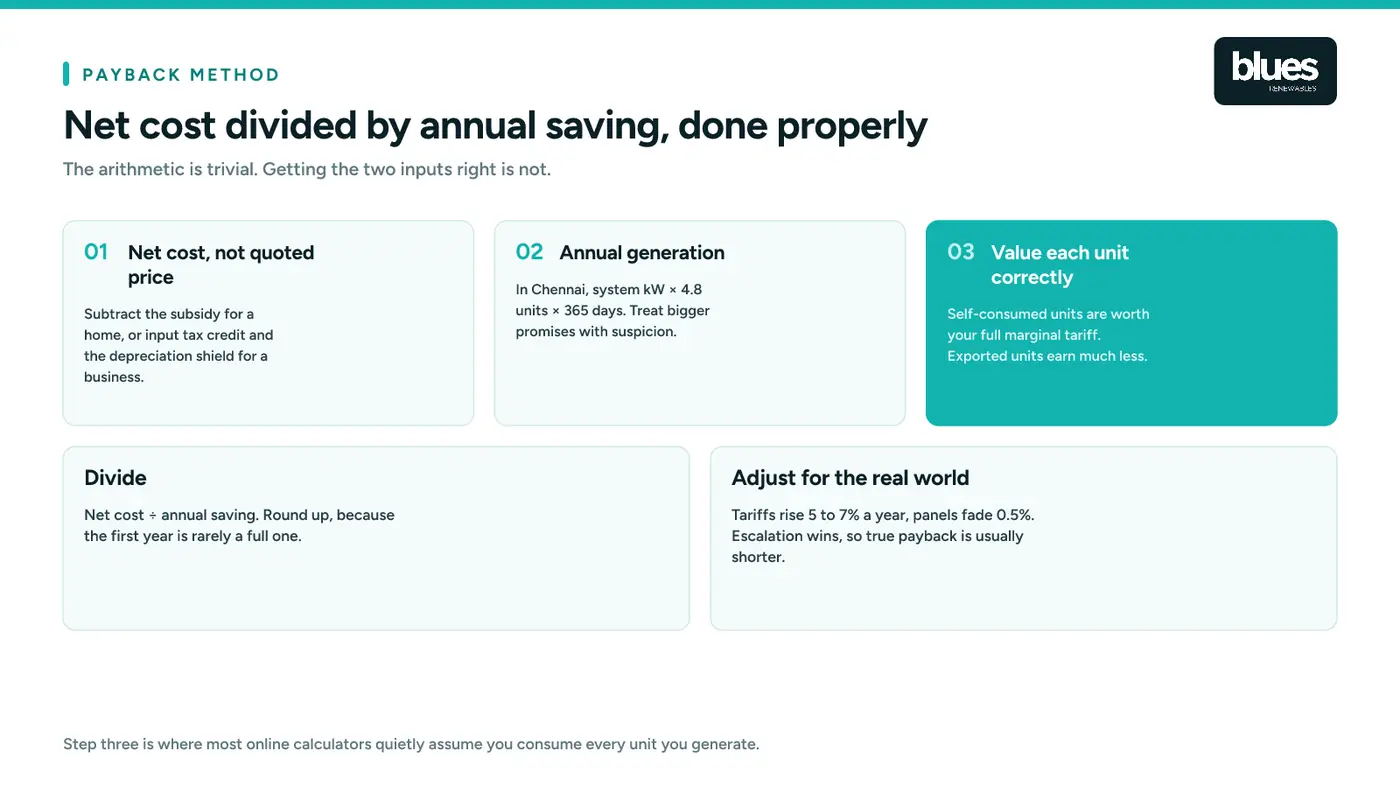
For a home, subtract the PM Surya Ghar subsidy: ₹30,000 per kW for the first 2 kW and ₹18,000 for the third, capped at ₹78,000 from 3 kW upward. It arrives 30 to 45 days after commissioning as a reimbursement, so you fund the full amount first. Details sit on our PM Surya Ghar subsidy page.
For a business, subtract two things instead. Input tax credit on the GST, where your consumption pattern allows you to claim it, and the tax saved by accelerated depreciation. Both are covered in GST on a solar power plant and how to calculate accelerated depreciation for solar in India.
Step 2: Estimate annual generation
For Chennai, use 4.8 units per kW per day, which reflects about 5.3 peak sun hours less real-world losses from temperature, dust, wiring and inverter conversion.
Annual generation = System size in kW × 4.8 × 365
A 5 kW system therefore produces roughly 8,760 units a year. Treat any quotation promising materially more than this for Chennai with suspicion.
Step 3: Value each unit correctly
This is the step that separates a useful answer from a fantasy.
Solar generates during daylight. Whatever you consume at that moment replaces a unit you would have bought, so it is worth your full marginal tariff. Whatever you do not consume is exported, and under net metering it earns a credit that is usually worth less.
Annual saving = (Self-consumed units × your marginal tariff) + (Exported units × export value)
Find your marginal tariff on your own bill: it is the rate on the highest slab you reach, not your average cost per unit. For a Tamil Nadu HT industrial connection it typically runs ₹8 to ₹9.50.
Self-consumption ratios in practice:
- Factory or office on a weekday load - Typical self-consumption: 85% to 100%
- Shop, showroom or hotel - Typical self-consumption: 75% to 90%
- School or college - Typical self-consumption: 60% to 80%, weekends and holidays drag it down
- Home with someone in during the day - Typical self-consumption: 50% to 70%
- Home empty from 9 to 6 - Typical self-consumption: 25% to 40%
That last row explains why two identical homes get very different paybacks. It is also why oversizing a residential system rarely pays: the extra units get exported at a discount.
Step 4: Divide
Net cost divided by annual saving gives simple payback in years. Round up, because commissioning takes time and the first year is rarely full.
Step 5: Sanity check against the realistic version
Simple payback holds three things still that do not stay still. Adjusting for them usually makes the answer better, not worse.
- Grid tariffs rise, historically 5 to 7 percent a year in India. Your saving grows every year.
- Panels degrade, about 0.5 percent a year, so a 25 year old system still delivers roughly 88 to 90 percent of year one output.
- Maintenance costs money, negligible for a home beyond cleaning, and roughly 1 to 1.5 percent of capital cost annually for a large commercial plant.
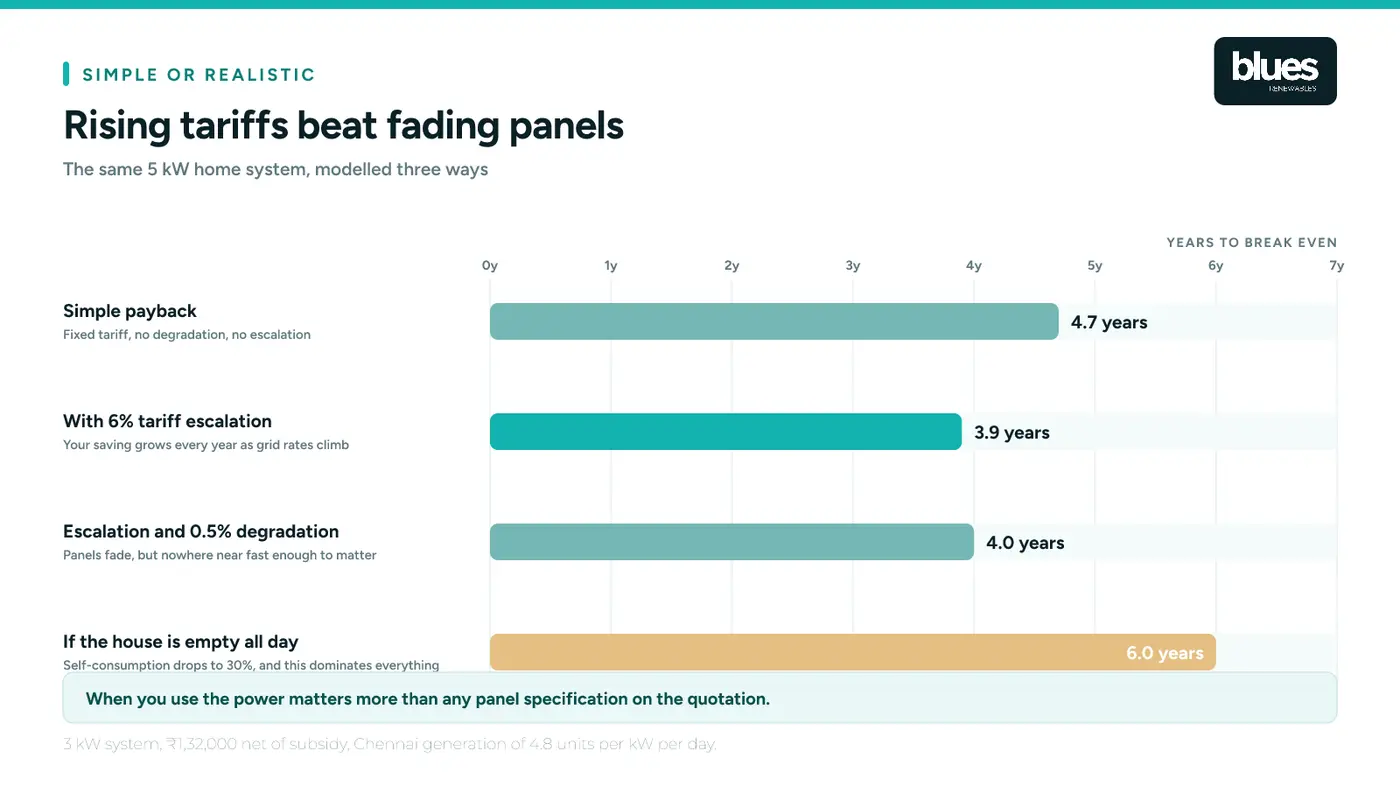
Escalation is the strongest of the three by a wide margin, so a system with a 4.5 year simple payback often reaches true break-even nearer 3.9 years.
Worked example: a 3 kW home in Chennai
- System cost - Value: ₹2,10,000
- PM Surya Ghar subsidy - Value: ₹78,000
- Net cost - Value: ₹1,32,000
- Annual generation - Value: 3 × 4.8 × 365 = 5,256 units
- Self-consumption, someone home during the day - Value: 60%, so 3,154 units
- Marginal tariff avoided - Value: ₹7.00
- Exported units - Value: 2,102 at ₹3.00 credit
- Annual saving - Value: ₹22,078 + ₹6,306 = ₹28,384
- Simple payback - Value: ₹1,32,000 ÷ ₹28,384 = 4.7 years
Now change one input. If the house is empty on weekdays and self-consumption falls to 30 percent, the annual saving drops to about ₹22,000 and payback stretches to 6.0 years. Same hardware, same roof, same city.
Shifting the washing machine, water heater and pump to daylight hours is worth more than any panel upgrade you could buy.
Worked example: a 100 kW commercial rooftop
- Contract value including GST - Value: ₹55,00,000
- Input tax credit reclaimed, where available - Value: about ₹4,50,000
- Year one depreciation shield at 40% and 25.17% - Value: about ₹5,08,000
- Net first-year outlay - Value: about ₹45,42,000
- Annual generation - Value: 100 × 4.8 × 365 = 1,75,200 units
- Self-consumption, weekday factory load - Value: 90%, so 1,57,680 units
- Marginal HT tariff avoided - Value: ₹8.50
- Exported units - Value: 17,520 at ₹3.00
- Annual saving - Value: ₹13,40,280 + ₹52,560 = ₹13,92,840
- Simple payback - Value: 3.3 years
The depreciation shield continues into later years, so the true position improves further. For factory-scale sizing, see can factories run on solar power in India and industrial solar in Chennai.
What benchmarks should you expect
- Under 4 years - Verdict: Excellent. Usually a business on a high tariff with strong daytime load.
- 4 to 5 years - Verdict: Good. Typical residential result after subsidy.
- 5 to 7 years - Verdict: Acceptable. Often a low self-consumption ratio or a modest tariff.
- Over 7 years - Verdict: Question it. Check the price per kW, the shading survey and your tariff.
Five things that quietly lengthen payback
Oversizing beyond your daytime load. Extra units get exported at a lower value, so the last kilowatt pays back far slower than the first.
Shading nobody surveyed. A water tank, parapet or neighbouring building can cost 10 to 20 percent of output. Insist on a shadow analysis, not a glance at the roof.
Skipping cleaning. Chennai dust and coastal salt cost 8 to 15 percent of generation if panels go unwashed through the dry months.
Counting the subsidy as a discount. It is a reimbursement paid 30 to 45 days after commissioning, so your cash is out first.
Using average cost per unit instead of the marginal rate. Solar displaces your most expensive units. Using the average understates the saving and makes a good project look mediocre.
Frequently asked questions
How do I calculate solar payback period? Divide your net system cost, after subsidy or after input tax credit and depreciation, by your annual saving. Annual saving is self-consumed units times your marginal tariff, plus exported units times the export credit.
What is the payback period for solar panels in India? Three to five years is typical in 2026. Residential systems land there after the PM Surya Ghar subsidy; commercial systems on high tariffs with strong daytime load often come in under four.
How long is solar panel payback time in practice? Usually shorter than the simple division suggests. Grid tariffs escalate 5 to 7 percent a year while panel output falls only about 0.5 percent, so the gap widens in your favour every year the system runs. Step 5 puts that realistic version against your own numbers.
What is the formula for solar payback? Payback in years equals net system cost divided by annual savings. The refinement that matters is splitting savings between self-consumed units at your full tariff and exported units at the lower credit rate.
How much does a solar panel generate per day in Chennai? About 4.8 units per kW per day averaged across the year, reflecting roughly 5.3 peak sun hours minus real-world losses. A 5 kW system produces around 24 units a day.
Does panel degradation change my payback much? Barely. At 0.5 percent a year it is comfortably outweighed by grid tariff escalation of 5 to 7 percent, so the realistic payback is usually shorter than the simple calculation suggests.
Should I include the subsidy when calculating payback? Yes, subtract it from the system cost. Remember it reaches you 30 to 45 days after commissioning rather than reducing the amount you must fund upfront.
Why is my payback longer than the calculator promised? Most often because the calculator assumed you consume every unit you generate. If you export half of it at a lower rate, your real saving is well below the modelled figure.
Does payback differ for CAPEX and OPEX? Payback only applies to CAPEX, where you own the plant and recover an investment. Under the OPEX model you invest nothing, so there is nothing to pay back, and you save less per unit in exchange.
Where this fits
Payback assumes you own the plant, so start with the CAPEX model in solar and compare it against the OPEX model in CAPEX vs OPEX vs RESCO solar. The two inputs that most change the answer are covered in GST on a solar power plant and what accelerated depreciation in solar is. For sizing, see how many solar panels are required for 3 kW and solar panel price in Chennai.
Blues Renewables has installed solar across Chennai since 2020, for homes, schools, businesses and factories. We build payback from your last twelve months of half-hourly consumption where the data exists, because the self-consumption ratio decides the answer and nobody can guess it from your roof.
Call +91 98841 07170 and we will calculate your solar payback period against your real bills rather than a generic assumption.
Sources
- MNRE, Guidelines for implementation of PM Surya Ghar: Muft Bijli Yojana
- Tamil Nadu Electricity Regulatory Commission, Tariff Order No.6 of 2025 dated 30 June 2025
- Press Information Bureau, Ministry of New and Renewable Energy, "GST on Renewable Energy Devices Rationalised to 5%", 17 September 2025
- Income Tax Act 1961, Section 32; Income Tax Rules, Appendix I depreciation schedule
- Blues Renewables installation data, Chennai, 2020 to 2026, for generation and self-consumption ranges