






For businesses and factories
Commercial solar ROI and depreciation calculator
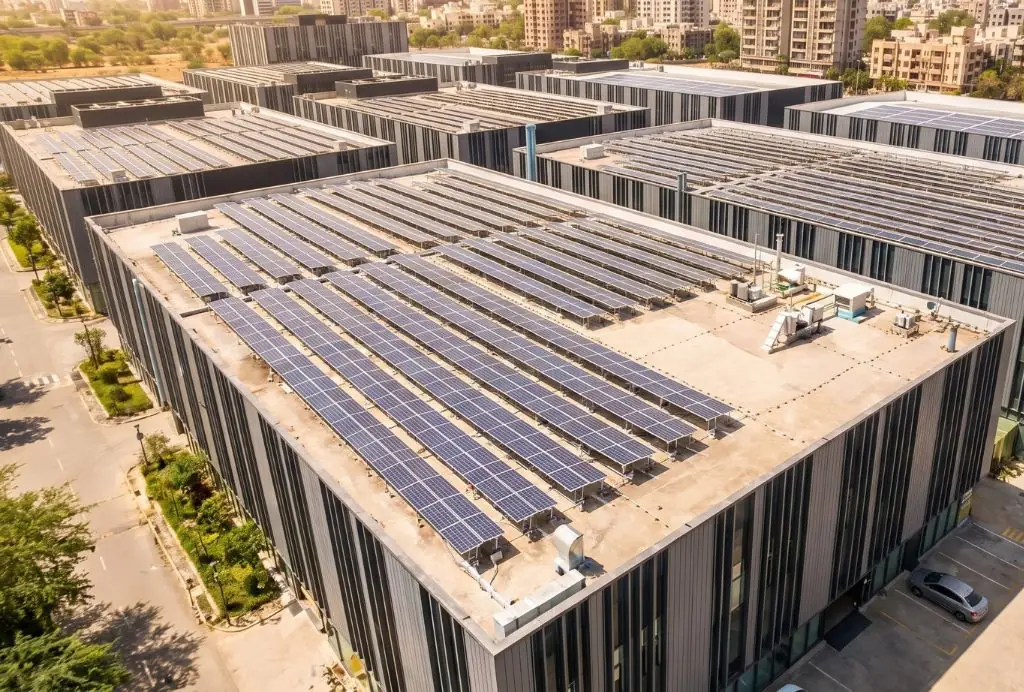
Estimate annual generation, bill savings, system cost and simple payback for a commercial rooftop plant in Chennai. Toggle accelerated depreciation for a first-year tax benefit estimate. These are planning figures — a site survey still decides the real answer.
Your inputs
Generation uses 4.5 units per kW per day × 365. Savings are capped at your annual bill so the model does not invent export income.
Simple payback
2.0 years
After estimating a 40% first-year accelerated depreciation benefit on system cost.
Annual generation
82,125 units
Annual savings
₹6,98,063/yr
System cost
₹23,50,000
AD year-1 benefit
₹9,40,000
5-year cash position
Over five years, estimated bill savings of ₹34,90,313 plus the year-1 AD benefit of ₹9,40,000 leave a cash position of about ₹20,80,313 versus the ₹23,50,000 system cost (before financing and degradation).
How to read this
What this commercial ROI estimate includes
The model multiplies system size by 4.5 units per kW per day across 365 days, prices that generation at your tariff, and caps savings at your current annual bill. System cost is size × cost per kW. Simple payback divides net cost (after optional AD benefit) by annual savings. It does not model financing, tariff escalation, degradation or export rates — those belong in a proper commercial proposal.
Commercial solar ROI questions
What payback should a commercial plant in Chennai expect?
Many daytime-load commercial roofs land between three and six years on a simple payback, depending on tariff, utilisation and whether accelerated depreciation applies. Night-heavy loads with low daytime demand take longer because less generation displaces grid purchase.
How does accelerated depreciation change the ROI?
This tool estimates a 40% first-year depreciation benefit on system cost as a planning shortcut. Actual tax benefit depends on your profit, tax rate and accountant’s treatment. Toggle it off if you want a pre-tax payback view.
Why is generation fixed at 4.5 units per kW per day?
It is a conservative Chennai working average used across our calculators (about 1,640 units per kW per year). Shading, orientation, soiling and inverter losses can move the real number, which is why a survey still matters.
Is CAPEX always better than OPEX / RESCO?
Not always. CAPEX usually wins on total lifetime cost if you can fund the plant and use depreciation. OPEX or RESCO can win when capital is constrained or you prefer a tariff discount without owning the asset. Compare structures on our CAPEX vs OPEX page.
Next step
Get a commercial proposal for your site
Share a recent bill and roof photos. We will refine generation, CAPEX and payback for your factory, warehouse or campus in Chennai.
Call +91 98841 07170