



National reference · no quote attached
Solar Power Plant Cost in India, by Capacity
Last reviewed August 2026 · cost, land, generation and returns · assumptions stated in full
A MW-scale solar power plant costs ₹3.5 to ₹4.5 crore per MW to build turnkey in 2026, needs 4 to 5 acres of land per MW, and generates about 16.5 to 17.2 lakh units per MW each year in Tamil Nadu, and 16.5 to 18.2 lakh across India. Per-MW cost falls as capacity rises, from around ₹4 crore at 1 MW to ₹3.2 to ₹3.6 crore at 100 MW. Land is excluded from every figure on this page and quoted separately.
The line that decides the project: the cost per MW barely moves between competent contractors. What moves the return by a factor of three is who consumes the unit you generate.
Assumptions used throughout
18.9–19.6% CUF, Tamil Nadu irradiation, fixed-tilt ground mount, non-DCR modules, land excluded, O&M at ₹5–6 lakh per MW per year, module degradation 0.5% a year. Change any of these and the numbers move.
Get a free feasibility read for your MW-scale site
Tell us the district, the extent of land and the capacity you have in mind. We reply in writing before you pay anyone for a project report.
Cost per MW
What a plant costs, by capacity
Turnkey engineering, procurement and construction of a fixed-tilt ground-mount plant runs ₹3.5 to ₹4.5 crore per MW in 2026, or ₹35 to ₹45 a watt. The band is wide because it absorbs module technology, terrain, foundation type and distance to the evacuation point. Land sits outside it in every case, because a plot in Ramanathapuram and a plot outside Sriperumbudur are not the same purchase.
| Capacity | Turnkey capex | Land | Annual generation | Typical structure |
|---|---|---|---|---|
| 1 MW → | ₹3.8–4.3 cr | 4–5 acres | 16.5–18 lakh units | PM-KUSUM, captive |
| 2 MW → | ₹7.2–8.2 cr | 8–10 acres | 33–36 lakh units | PM-KUSUM ceiling, group captive |
| 5 MW → | ₹17.5–20 cr | 20–25 acres | 83–91 lakh units | Group captive, open access |
| 10 MW → | ₹34–38.5 cr | 40–50 acres | 1.66–1.82 crore units | Open access, IPP |
| 100 MW → | ₹320–360 cr | 400–500 acres | 16.6–18.2 crore units | IPP, central or state tender |
Cost breakdown
Where ₹4 crore actually goes
Percentages below are for a 1 MW fixed-tilt ground-mount plant at the middle of the capex band. Modules dominate, which is why a quotation is really a bet on module pricing at the time of procurement. Everything else is engineering that either holds for 25 years or does not.
| Line item | Share | At 1 MW | What moves it |
|---|---|---|---|
| Solar modules | 45% | ₹1.80–1.95 cr | Non-DCR TOPCon bifacial at ₹16–19 a watt. DCR cells, needed for PM-KUSUM and most government tenders, add ₹5–8 a watt. |
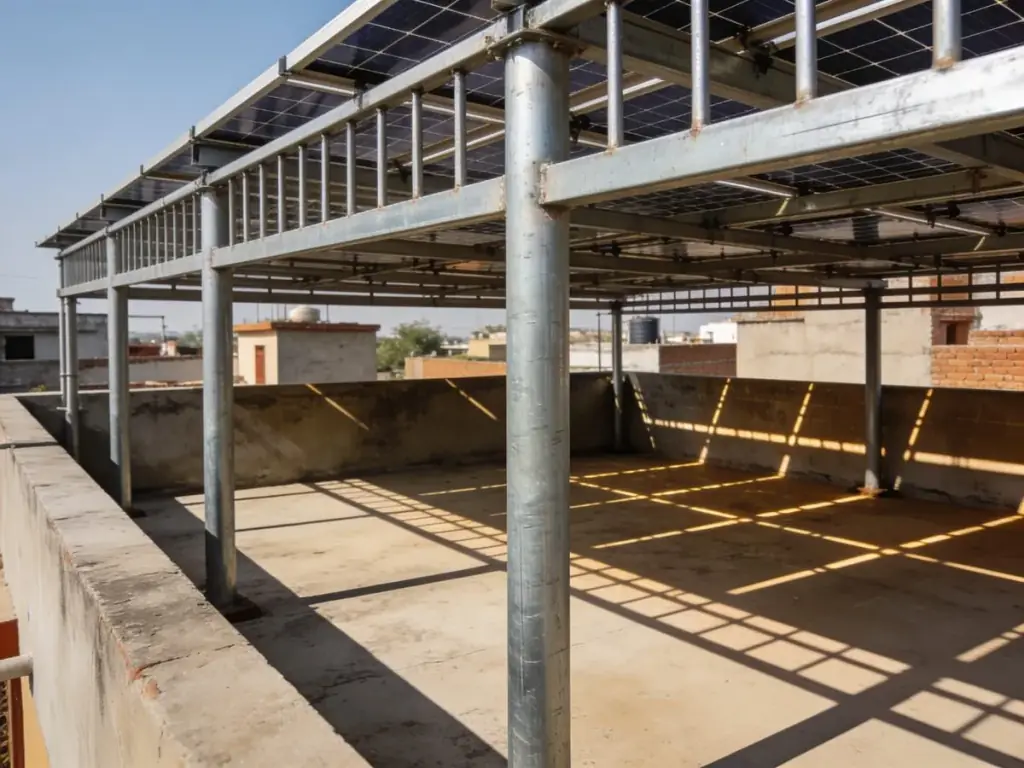
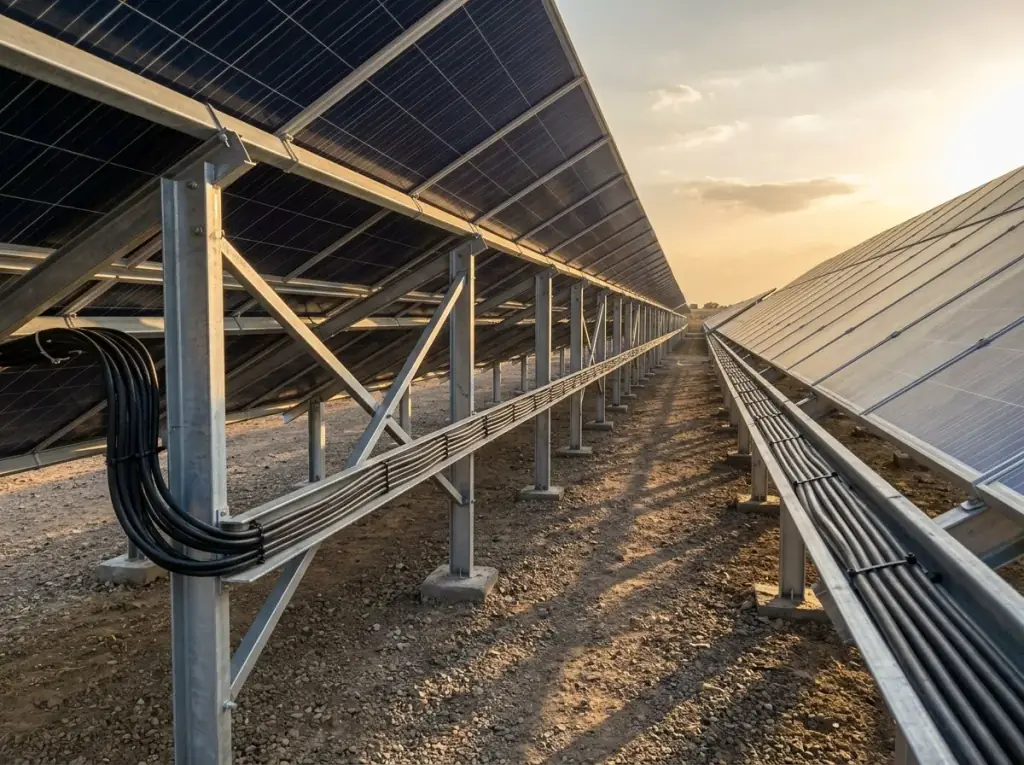
| Mounting structure | 11% | ₹42–48 lakh | Galvanised steel or aluminium, fixed tilt. Foundation type follows the geotechnical report, not the quotation. |
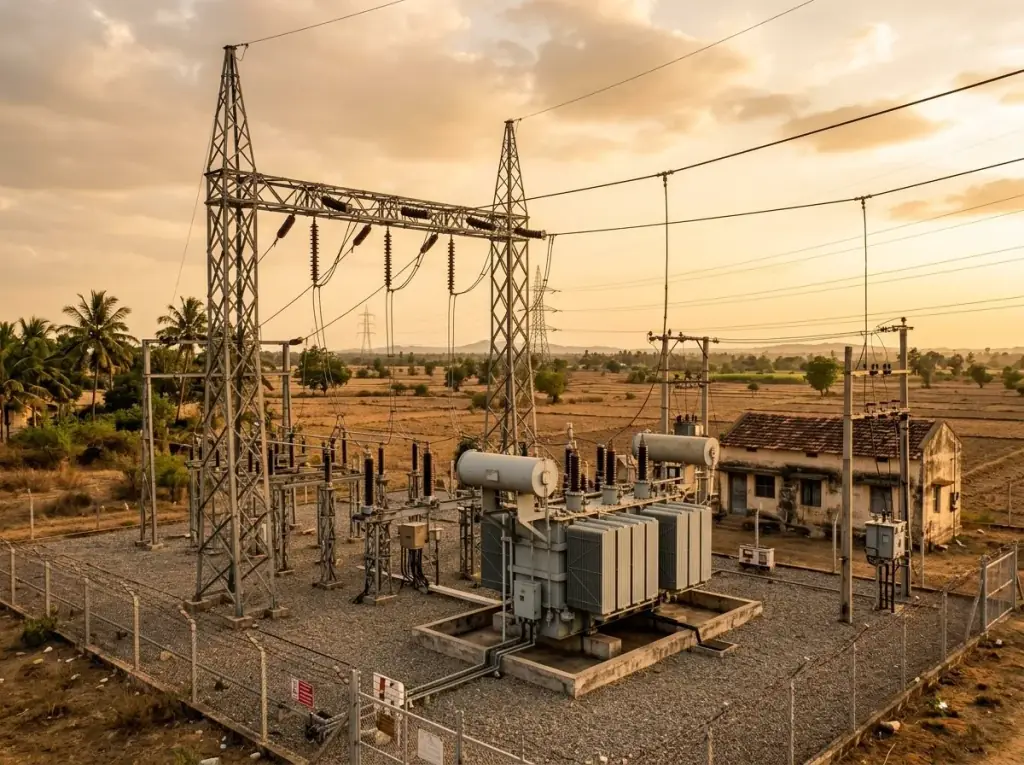
| Transformer, HT switchgear, evacuation | 9% | ₹34–40 lakh | Rises sharply with distance to the substation. A plant 8 km out is a different project from one 1 km out. |
| Inverters | 9% | ₹32–38 lakh | Central or string, plus the combiner boxes and monitoring interface. |
| DC and AC cabling, LT panels | 8% | ₹30–35 lakh | The line most often value-engineered downward, and the one that quietly costs you generation for 25 years. |
| Civil, foundations, roads, fencing | 8% | ₹30–35 lakh | Site levelling, cable trenches, internal roads, boundary wall or fencing, inverter station plinths. |
| Approvals, connectivity, insurance, pre-operative | 5% | ₹18–22 lakh | Connectivity charges, CEIG, consent to establish, erection all-risk cover, financing fees. |
| Monitoring, weather station, SCADA | 2% | ₹7–9 lakh | Required by most lenders and by any serious O&M contract. |
| Erection, commissioning, freight, contractor margin | 3% | ₹12–15 lakh | Compressed on competitive tenders, which is usually visible later in workmanship. |
Four things that move the number more than the module brand
DCR versus non-DCR cells. Domestic content is mandatory for PM-KUSUM and most government tenders, and adds ₹5 to ₹8 a watt. On a 1 MW plant that is ₹50 lakh to ₹80 lakh of pure compliance cost.
Distance to the evacuation point. Every extra kilometre of line and every additional bay at the substation is real money, and it is the item most often missing from an early estimate.
Terrain and soil. Rock needs drilling, black cotton soil needs deeper foundations, a slope needs benching. The geotechnical report changes the civil cost, not the sales pitch.
Trackers versus fixed tilt. Single-axis tracking lifts generation 12 to 18 per cent, costs more per MW, needs more land per MW and adds moving parts to maintain. It pays at scale and rarely below 5 MW.
On GST
A turnkey solar EPC contract is treated as a composite supply, deemed 70 per cent goods and 30 per cent services, which lands at an effective rate of roughly 8.9 per cent rather than a single headline rate.
Whether a quotation is inclusive or exclusive of that is worth establishing in the first conversation, because on ₹4 crore it is ₹36 lakh. Appointing an EPC contractor covers the rest of the contract.
Land
Four to five acres per MW, and why it is a range
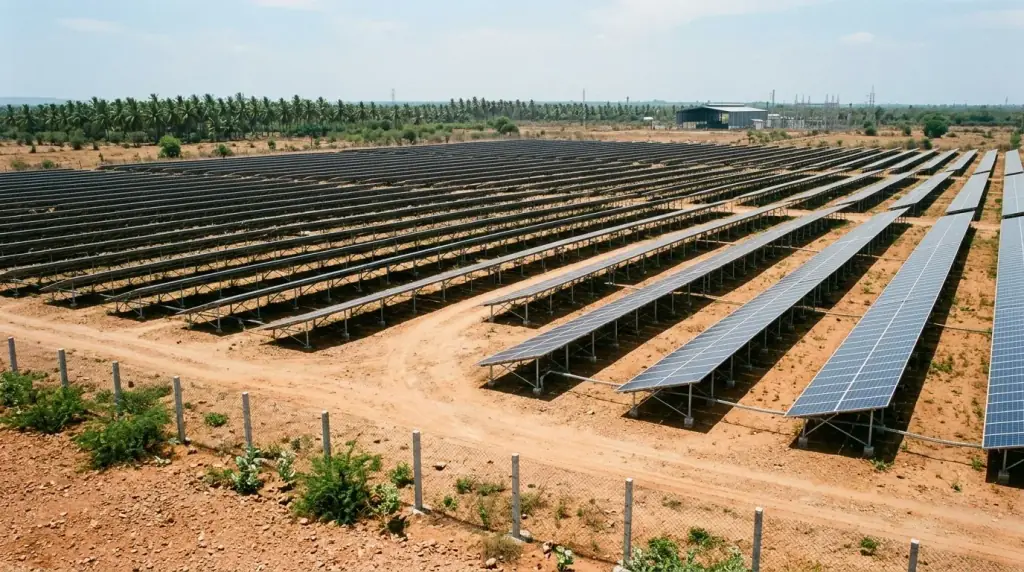
A 1 MW solar power plant requires 4 to 5 acres of land on a fixed-tilt structure. Only about a third of that is under module; the rest is the gap between rows that stops one row shading the next in December, plus service roads, the inverter stations, the switchyard and the setback at the boundary. Mounting type changes the answer more than anything else.
| Mounting | Acres per MW | Generation effect |
|---|---|---|
| Fixed tilt | 4–5 | Baseline |
| Seasonal tilt | 5–6 | +3 to +5%, manual adjustment twice a year |
| Single-axis tracker | 6–8 | +12 to +18%, more capex and more maintenance |
| Stilt mount over crops | 5–7 | Slightly lower, but the land keeps farming |
Land classification is the thing that kills projects
Wrong land classification, a substation distance measured on a map instead of along the route, and missing consent from a co-owner are what push a project six to eighteen months past its promised date. All three are cheap to check before money is committed and expensive afterwards.
Land required for a 1 MW plant goes through classification, conversion, site selection and lease-versus-purchase economics.
Generation
How many units a MW actually produces
A 1 MW solar power plant generates about 16.5 to 17.2 lakh units a year in Tamil Nadu, and 16.5 to 18.2 lakh across India, which is roughly 4,500 to 5,000 units on an average day. The number that produces that answer is the capacity utilisation factor: 18.9 to 19.6 per cent for fixed tilt in this state, 20.3 to 20.8 in Rajasthan and Gujarat, and the bottom of the band on the Kerala coast. Anyone quoting generation without quoting a CUF is quoting nothing.
Per day, per MW
4,500–5,000
units, annual average. A clear March day beats a July monsoon day by a factor of two.
Per month, per MW
1.2–1.4 lakh
units. February to May run well above this, October and November well below.
Per year, per MW
16.5–17.2 lakh
units in year one, at 18.9–19.6% CUF.
Over 25 years
~3.6 crore
units, after 0.5% a year degradation. Year 25 produces about 88% of year one.
Project structures
Five ways to own a MW, and they are not equally available to you
The plant is the same in all five. What differs is who owns it, who consumes the power, what the unit is worth, and which regulations apply. This is the decision that sets the return, and it should be made before anyone is asked for a price.
Structure matcher
Two questions, five outcomes
Likely structure
Captive, behind the meter
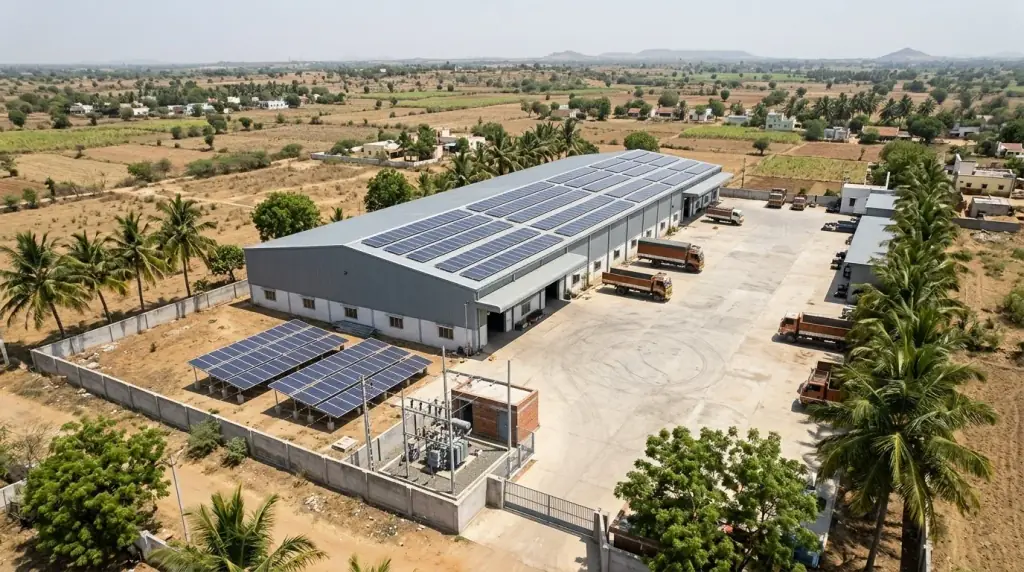
Your plant, your land, your load. Every unit displaces one you would have bought at ₹7 to ₹8.50, there is no wheeling, no third party and no surcharge, and it is the fastest payback available at any capacity.
The limit is your daytime consumption and your available land or roof. A plant larger than your load exports the surplus at a much lower rate, which changes the return sharply.
Commercial and industrial solar →Captive, behind the meter
You own the plant, it sits on your land, and every unit displaces a unit you would have bought at ₹7 to ₹8.50. The best return available, and the only structure with no wheeling charges, no banking rules and no third party.
Group captive
Consumers hold at least 26 per cent of the equity and consume at least 51 per cent of the generation, which buys exemption from cross-subsidy surcharge. Compliance has to hold every year, not just at signing.
Third-party PPA under open access
A developer builds and owns; you sign a 15 to 25 year power purchase agreement and pay per unit with no capital outlay. The charge stack decides whether it beats your grid tariff.
IPP selling to a tender
You bid into a central or state auction and sell at the discovered tariff, currently ₹2.80 to ₹3.40. Thin margins, real scale, and a business rather than a cost-saving exercise.
PM-KUSUM Component A
500 kW to 2 MW on barren, fallow or agricultural land, built by farmers, farmer groups, cooperatives, panchayats, FPOs or water user associations, with the DISCOM buying at a regulator-set feed-in tariff. The national target is 10,000 MW.
Money
Financing, and the subsidy that does not exist
Lenders typically fund 70 to 75 per cent of project cost at 9.5 to 11 per cent over 10 to 13 years. IREDA, PFC and REC lend to the sector directly, NABARD funds farmer-owned projects, and nationalised banks treat agricultural solar as priority sector lending. What a sanction actually turns on is not the technology but the offtake: a signed arrangement to sell the power, and a project report a lender's engineer can check.
Correction, and it matters
There is no PM Surya Ghar subsidy on a 1 MW plant
PM Surya Ghar is a residential rooftop scheme, capped at ₹78,000 for a home. It does not extend to MW-scale ground-mount plants at any capacity, and a financial model built on it is wrong before it starts.
PM-KUSUM is the farmer scheme and it is a different thing entirely: different eligibility, different implementing agency, different money. Confusing the two is the most common error in this market.
What does apply at MW scale
- Accelerated depreciation. 40 per cent plus a 20 per cent additional allowance in year one for a taxable entity. Often the single largest incentive available.
- PM-KUSUM Component A. For 500 kW to 2 MW farmer-owned plants, with a DISCOM performance-based incentive of ₹0.40 a unit or ₹6.6 lakh per MW installed, whichever is less, for five years from commercial operation.
- State solar policy incentives. Electricity duty exemption, stamp duty concessions and banking provisions, which vary by state and by year.
- Viability gap funding. On specific central tenders only, not available to a private project on request.
Debt
70–75%
of project cost, leaving 25 to 30 per cent promoter equity. IREDA-financed PM-KUSUM projects have run at 8.5 to 10.5 per cent.
Interest and tenure
9.5–11%
over 10 to 13 years, with lenders generally wanting a debt service coverage ratio above 1.2 through the tenure.
Why applications fail
No signed offtake, unclear land title, a generation estimate with no stated CUF, or a project report that reads like a brochure.
Development timeline
Land to commercial operation, and where it slips
Construction is the short part. A first-time developer should plan 12 to 24 months from securing land to commercial operation, of which the physical build is four to seven months at 1 to 5 MW. Approvals and grid connectivity are what actually set the date, and they run in parallel with financing rather than after it.
01
Site, before anything else
Title, classification, encumbrance, co-owner consent, route distance to the nearest substation with spare capacity, and a soil test. A plot that fails any of these is not a cheap plot, it is not a plot.
02
Connectivity, in parallel
Feasibility and connectivity approval from the DISCOM or transmission utility. Spare bay capacity at the substation is finite and allocated in order of application, not in order of readiness.
03
Approvals, the long pole
Electrical inspectorate approval before charging, land use conversion where the land is agricultural, pollution board consent, and the connectivity or power purchase agreement itself.
04
Build, then prove it
Four to seven months of construction at 1 to 5 MW, then testing, metering and commercial operation. Retention and the defect liability period start here, not at handover of the invoice.
Where we fit, and where we do not
We are not a MW-scale developer
This page exists because the numbers are hard to find and mostly wrong where they are. It is not a pitch for a 100 MW project. Blues Renewables does not own plants, does not bid central tenders and does not hold power purchase agreements. Being clear about that is more useful to you than a capability claim we would have to walk back on a site visit.
What we do at MW scale
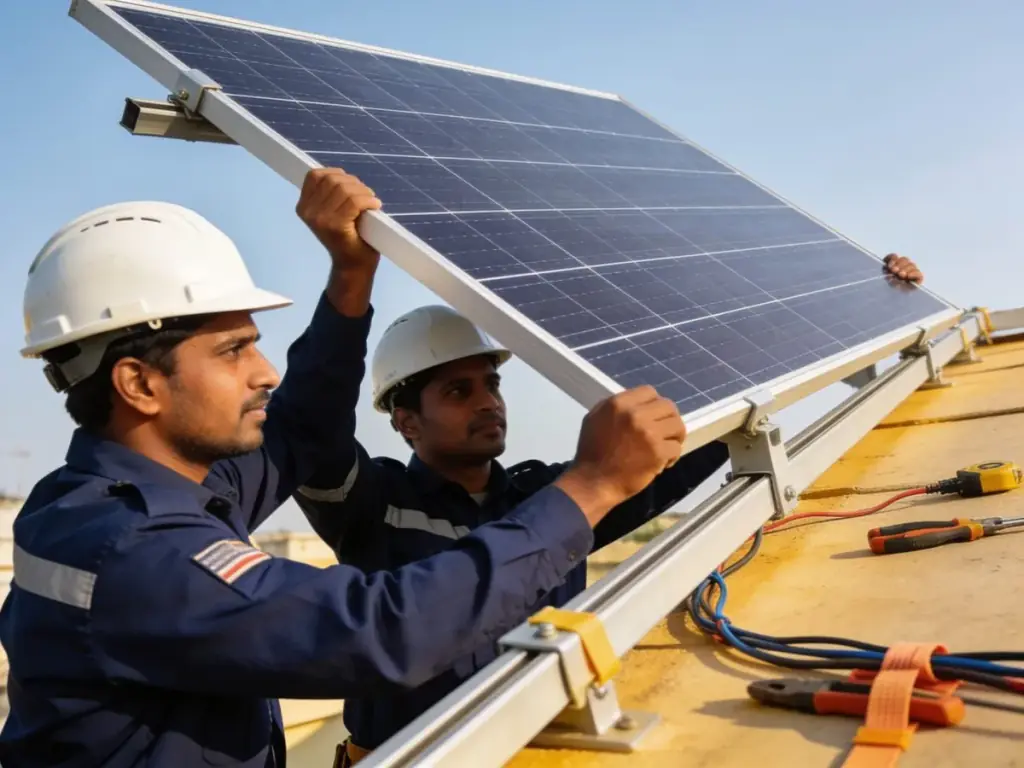
- Subcontract EPC and balance-of-system packages inside somebody else's project: structures, DC and AC works, earthing, module installation, testing.
- Full turnkey delivery at the rooftop and ground-mount sizes we have actually built, in and around Chennai and across Tamil Nadu.
- A free feasibility read on a site you are considering: land classification, route distance to the substation, a CUF sanity check and a capex sanity check.
What you will need someone else for
- A bankable detailed project report and a lender's engineer to certify it.
- Land aggregation, title diligence and conversion.
- A principal EPC contractor carrying the whole scope on a plant above the sizes we build.
- Tender bidding, if you intend to sell into a central or state auction.
Before you pay anyone for a project report
Tell us the district, the extent of land and the capacity you have in mind. We will come back with a written feasibility read: whether the land classification works, how far the nearest substation with spare capacity actually is by route, whether your generation assumption is defensible, and whether the capex you have been quoted is inside the band on this page. No cost, and no obligation to use us for anything.
The capacity field is the only qualification we need. It tells us in one line whether this is a Component A project, a captive plant, or something we should hand to someone larger.
MW-scale solar, answered
How much does a 1 MW solar power plant cost in India?
A 1 MW solar power plant costs roughly ₹3.8 to ₹4.3 crore to build turnkey in 2026, excluding land. Modules account for about 45 per cent of that, with the balance split across inverters, mounting structure, cabling, civil works, the transformer and evacuation, monitoring, approvals and the contractor’s margin. Per-MW cost falls as capacity rises, reaching about ₹3.2 to ₹3.6 crore per MW at 100 MW.
How much land is required for a solar power plant?
A solar power plant needs 4 to 5 acres of land per MW on a fixed-tilt structure. Seasonal tilt pushes that to 5 to 6 acres and single-axis trackers to 6 to 8 acres, because rows must be spaced further apart to avoid shading each other. The range within fixed tilt depends on module efficiency, terrain slope and how much room the site needs for roads, the inverter stations and the switchyard.
How many units does a 1 MW solar plant generate?
A 1 MW solar plant generates about 16.5 to 17.2 lakh units a year in Tamil Nadu, and 16.5 to 18.2 lakh across India, which is roughly 4,500 to 5,000 units on an average day. That assumes a capacity utilisation factor of 18.8 to 20.8 per cent. Output falls about 0.5 per cent a year as the modules degrade, so a 25-year model should not use the first-year figure throughout.
Is there a subsidy for a 1 MW solar power plant?
No. PM Surya Ghar is a residential rooftop scheme capped at ₹78,000 and does not apply at MW scale, which is the single most common misconception in this market. What does apply is accelerated depreciation, PM-KUSUM Component A for farmer-owned plants of 500 kW to 2 MW, state solar policy incentives, and viability gap funding on specific central tenders.
What is the payback period for a MW-scale solar plant?
Five to seven years where the plant offsets your own industrial tariff, and ten to twelve years where it sells to a DISCOM at a feed-in tariff of ₹2.80 to ₹3.40 a unit. The gap is entirely about the value of the unit generated, not about the cost of the plant. Who consumes the power matters more to the return than any equipment decision.
Can I get a bank loan for a solar power plant?
Yes. Lenders typically fund 70 to 75 per cent of project cost at 9.5 to 11 per cent over 10 to 13 years, against the project’s cash flows plus collateral. IREDA, PFC and REC lend to the sector directly, NABARD funds farmer-owned projects, and IREDA-financed PM-KUSUM projects have run at 8.5 to 10.5 per cent. A signed offtake arrangement and a bankable detailed project report are the two things a sanction depends on.
What is the maximum capacity under PM-KUSUM Component A?
Two MW. Component A covers decentralised ground or stilt-mounted grid-connected plants of 500 kW to 2 MW set up by individual farmers, farmer groups, cooperatives, panchayats, FPOs and water user associations, with the DISCOM buying the power at a feed-in tariff set by the state regulator. Anything above 2 MW falls outside the scheme entirely.
What approvals does a MW solar power plant need?
Grid connectivity approval from the DISCOM or transmission utility, land classification and conversion where the land is agricultural, an electrical inspectorate approval before charging, pollution control board consent, and a connectivity or power purchase agreement covering evacuation. Approvals and connectivity typically run three to six months in parallel, and are the most common cause of a slipped commissioning date.