





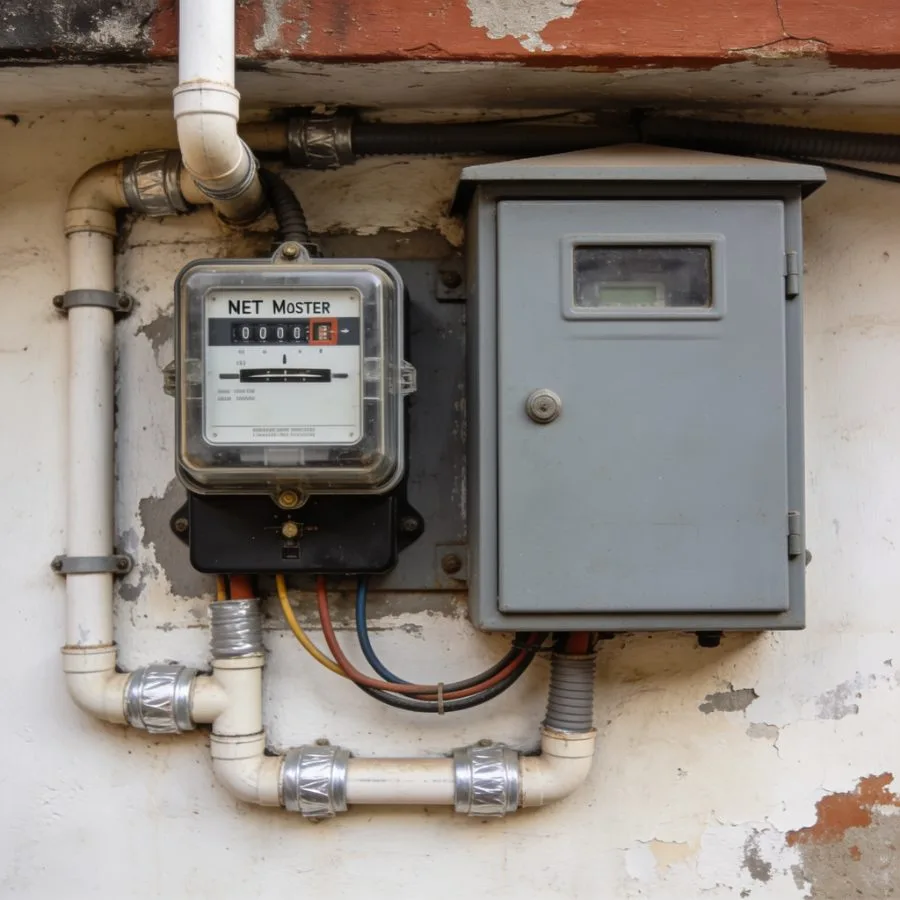
Capacity anchor · 2026 pricing
1 MW Solar Power Plant Cost in India
Last reviewed August 2026 · capex, land, generation and profit · every assumption stated
A 1 MW solar power plant costs ₹3.8 to ₹4.3 crore to build turnkey in 2026, excluding land. It needs 4 to 5 acres, generates about 16.5 to 17.2 lakh units a year in Tamil Nadu at 18.9 to 19.6 per cent CUF, and returns ₹47.6 lakh a year at a DISCOM feed-in tariff or about ₹1.24 crore a year when it displaces your own industrial tariff. Payback runs from about three years to about eight and a half, on the same plant.
Read the second number, not the first. Capex varies about 15 per cent between competent contractors. The return varies by a factor of three depending on who consumes the unit.
Baseline on this page
1,000 kWp of non-DCR modules, fixed tilt, level terrain, 1 km to the evacuation point, land excluded, 18.9–19.6% CUF, O&M at ₹5.5 lakh a year, degradation 0.5% a year. The configurator below changes each of these.
Get a free feasibility read for your 1 MW site
Send the district and the extent. We reply in writing on land classification, substation distance and whether the capex you have been quoted is sane.
Capex configurator
Four decisions that take ₹3.8 crore to ₹5.7 crore
The same 1 MW is quoted anywhere between ₹3.8 crore and well past ₹5.5 crore, and the gap is almost never contractor margin. It is cell origin, mounting type, what is under the soil and how far the power has to travel to reach a substation. Set them and watch the number move.
Cost breakdown
The ₹4 crore, line by line
Baseline plant: 1,000 kWp of non-DCR modules on fixed tilt, level terrain, one kilometre to the evacuation point. Modules are 45 per cent of it, which means a quotation is largely a bet on module pricing at the moment of procurement. Ask when the quoted price expires.
| Line item | Cost | Share | What to check in the quotation |
|---|---|---|---|
| Solar modules | ₹1.75 cr | 46% | Wattage, cell technology, ALMM listing, DCR status, and the date the price expires. |
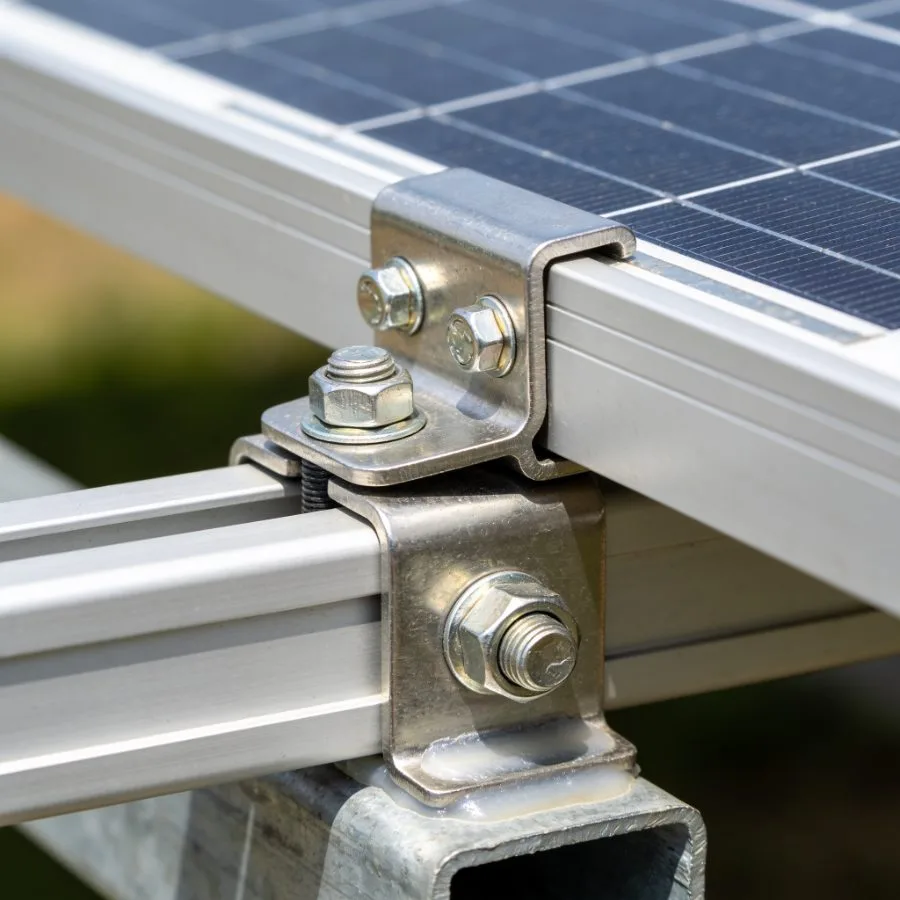
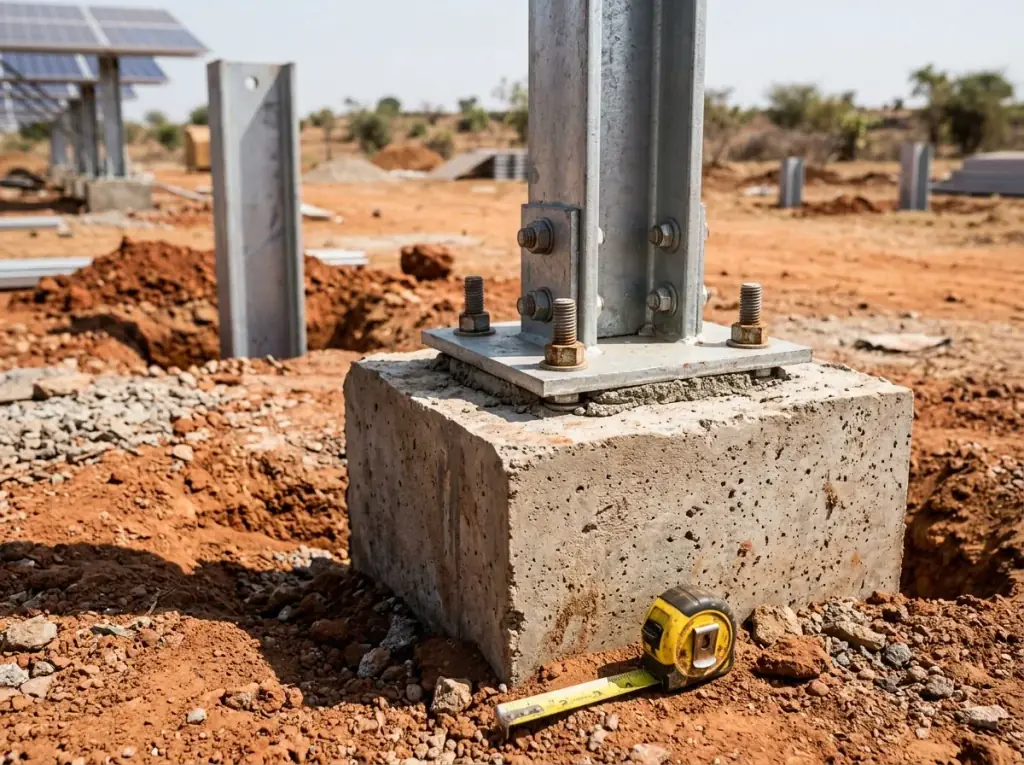
| Mounting structure | ₹45 lakh | 12% | Steel section, galvanising thickness in microns, and whether foundations follow a soil report. |
| Inverters and combiners | ₹35 lakh | 9% | Central or string, DC to AC ratio, warranty term, and who services them in year six. |
| DC and AC cabling, LT panels | ₹32 lakh | 8% | Cable sizes and the design voltage drop. The most common place a price is quietly cut. |
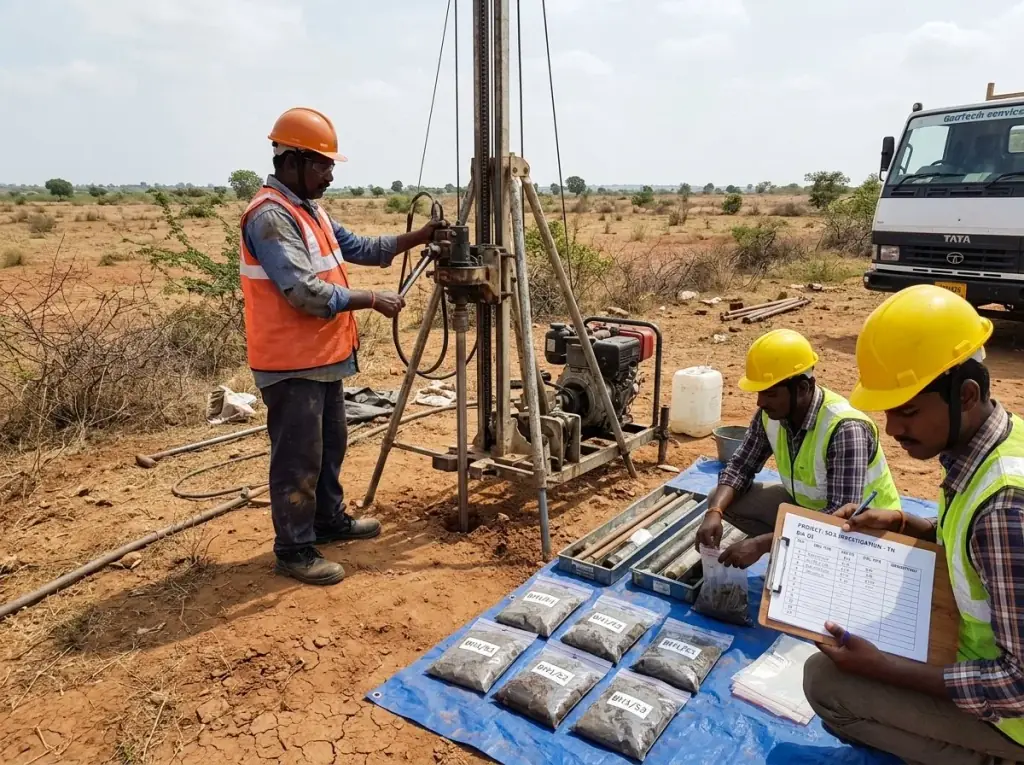
| Civil, foundations, roads, fencing | ₹30 lakh | 8% | Whether a geotechnical investigation was done, or assumed. |
| Transformer, HT switchgear, line | ₹22 lakh | 6% | At 1 km. Rises about ₹14 lakh per additional kilometre, and is often excluded entirely. |
| Approvals, insurance, pre-operative | ₹20 lakh | 5% | Connectivity charges, CEIG, consent to establish, erection all-risk cover. |
| Erection, commissioning, margin | ₹14 lakh | 4% | Compressed hard on competitive tenders, and usually visible later in workmanship. |
| Monitoring, weather station, SCADA | ₹8 lakh | 2% | Required by most lenders and by any serious O&M contract. |
| Total, land excluded | ₹3.81 cr | 100% | ₹38.1 a watt. The lower end of the band, because every variable is at its easiest setting. |
Cost per MW
Why 1 MW is the most expensive MW you will ever build
Approvals, connectivity, mobilisation, monitoring and the switchyard cost roughly the same whether the plant is 1 MW or 5 MW. Spread across a single megawatt they are the reason per-MW cost is highest at the smallest capacity, and why the curve flattens once you pass 10 MW.
At 1 MW
₹4.05 cr
per MW, midpoint. Fixed development costs carried by a single megawatt.
At 5 MW
₹3.75 cr
per MW. Roughly ₹1.5 crore saved against building five separate 1 MW plants.
At 100 MW
₹3.40 cr
per MW. The floor for a fixed-tilt plant at current equipment pricing.
So why build 1 MW
Because it matches a real load, fits the land you have, and stays inside the PM-KUSUM ceiling. Cost per MW is the wrong optimisation if the extra megawatts have nowhere to go.
Land
Four to five acres for 1 MW
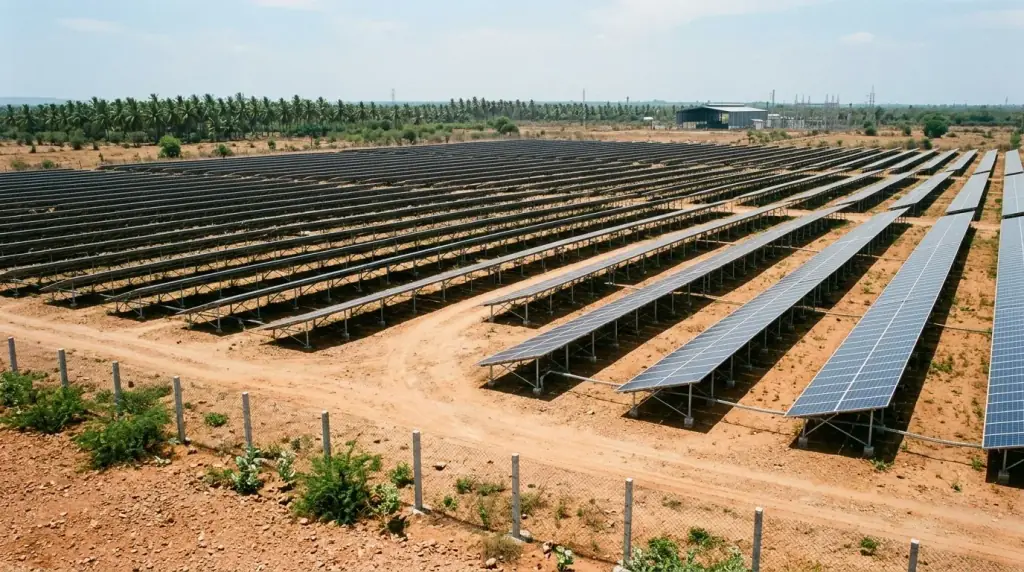
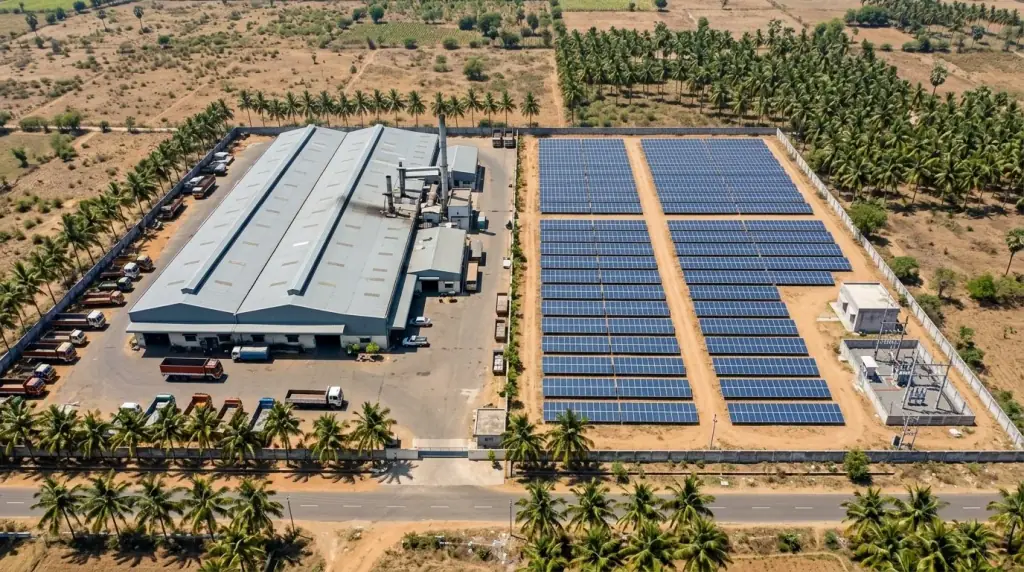
A 1 MW solar power plant needs 4 to 5 acres of land on a fixed-tilt structure. About a third of that is under module. The rest is row spacing set by the December shadow, internal roads, inverter station plinths, the switchyard and the boundary setback.
Land sits outside every capex figure on this page because it is not comparable between districts. Four acres near Sriperumbudur and four acres in Ramanathapuram are two different investments, and leasing changes the arithmetic again.
Land required for a 1 MW solar plant covers classification and conversion, site selection criteria, lease versus purchase economics, and stilt mounting that keeps the land in cultivation.
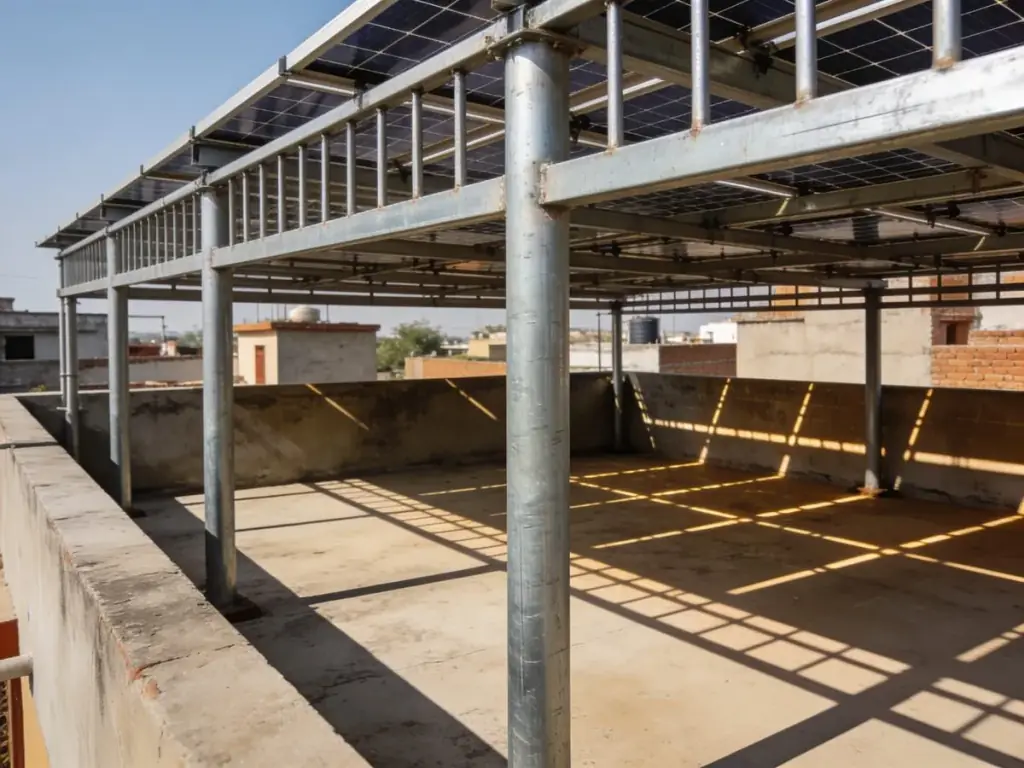
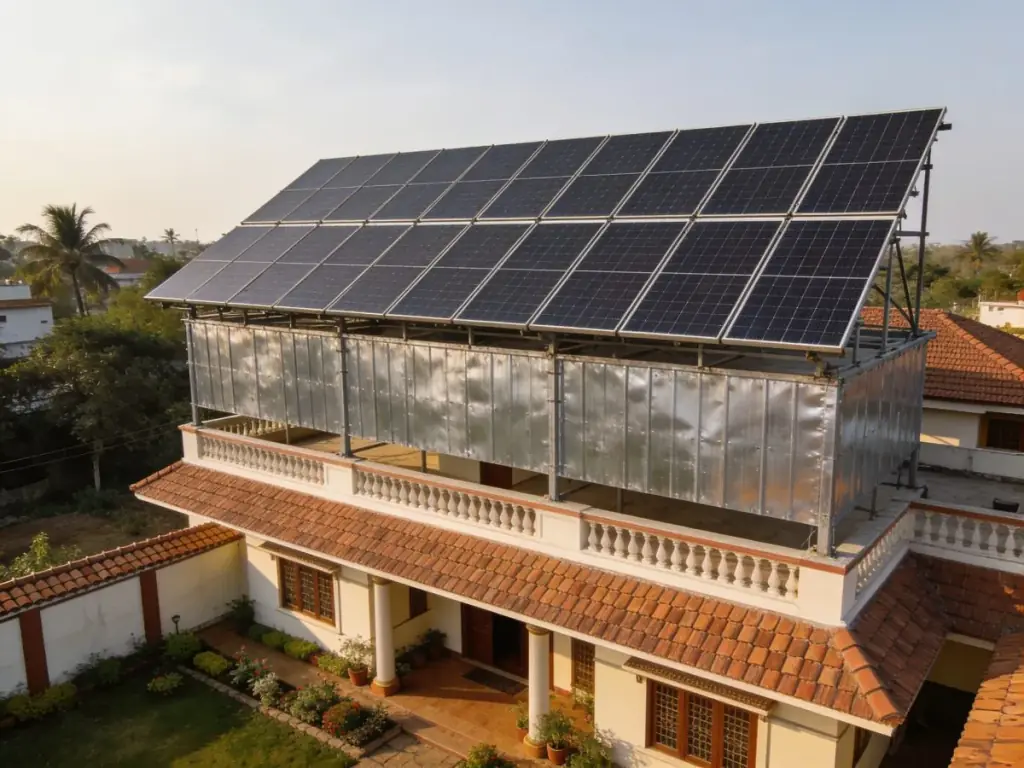
Land by mounting type, for 1 MW
PM-KUSUM Component A asks for four or more acres of barren, fallow or cultivable wasteland within five kilometres of a DISCOM substation.
Generation
16.5 to 17.2 lakh units a year, and the number behind it
A 1 MW solar power plant produces about 16.5 to 17.2 lakh units a year in Tamil Nadu, and 16.5 to 18.2 lakh across India, which is roughly 4,500 to 5,000 units on an average day. The whole answer rests on capacity utilisation factor: 18.9 to 19.6 per cent here, 20.3 to 20.8 per cent in Rajasthan, and the bottom of the band on the Kerala coast. A generation figure quoted without a CUF is not a figure.
Per day
4,500–5,000
units a day, India-wide band
Per month
1.3–1.5 lakh
units, March to May run well above
Year one
16.5–17.2 lakh
units at 18.9–19.6% CUF
Year 25
~14.4 lakh
units, after 0.5% a year degradation
How to check a generation claim in ten seconds
Annual units divided by 8,760 hours divided by the capacity in MW gives the implied CUF. If a proposal for a 1 MW plant in Tamil Nadu claims 19 lakh units, that is a 21.7 per cent CUF, which this state does not deliver on fixed tilt.
An inflated CUF is the easiest way to make a bad project look bankable, and the easiest thing on a proposal to check.
On the DC to AC ratio
A plant sold as 1 MW may be 1 MW of inverter capacity carrying 1.2 to 1.3 MWp of modules. That raises annual units and clips the midday peak, and it is a legitimate design choice.
It is not legitimate to compare it against a 1:1 plant on price per MW without saying so. Ask for both numbers.
Revenue and profit
The same plant, three completely different businesses
All three columns below are one 1 MW plant costing ₹4 crore and generating 16.6 lakh units a year. The only thing that changes is what a unit is worth. This is the decision that makes or breaks the project, and it is made before anyone is asked for a price.
| Sell to the DISCOM₹3.20 a unit | Third-party PPA₹5.50 a unit | Offset your own tariff₹7.80 a unit | |
|---|---|---|---|
| Annual revenue or saving | ₹53.1 lakh | ₹91.3 lakh | ₹1.29 cr |
| Less O&M and insurance | ₹5.5 lakh | ₹5.5 lakh | ₹5.5 lakh |
| Net annual | ₹47.6 lakh | ₹85.8 lakh | ₹1.24 cr |
| Simple payback on ₹4 cr | 8.4 years | 4.7 years | 3.2 years |
| What decides it | Tariff order and DISCOM payment record | The open access charge stack | How much of your load is daytime |
| Who it suits | Landowners and farmer groups under Component A | Developers with a creditworthy offtaker | Factories and campuses with their own load |
What the table leaves out, deliberately
Simple payback ignores debt, tax, depreciation benefit, tariff escalation and degradation. It is a screening number, useful for deciding whether to keep reading, and not a substitute for a model.
A lender wants project IRR, equity IRR and a debt service coverage ratio through the tenure. That is what a DPR is for.
Accelerated depreciation, briefly
A taxable entity can claim 40 per cent depreciation plus a 20 per cent additional allowance in the first year, which on ₹4 crore of plant is a substantial deferred tax benefit at the top of the project's life.
For a loss-making entity or a farmer group outside the tax net it is worth nothing, which is why the same plant is a better investment for some owners than others.
The 25-year view
A 1 MW plant generates roughly 3.85 crore units over 25 years after degradation. At ₹3.20 that is about ₹12.3 crore of revenue against ₹4 crore of capex and ₹1.4 crore of lifetime O&M.
The asset works. Whether the investment works depends on the tariff you can actually contract, and for how long.
State by state
A 1 MW plant costs about the same everywhere. It does not generate the same everywhere.
This is the question behind every "1 MW solar power plant cost in Gujarat" search, and the honest answer is that equipment is nationally priced. Capex varies within about five per cent between states, driven by civil works, logistics and labour. What genuinely differs is generation, because irradiation differs, and land, which sits outside capex entirely. Same money, different output.
| State | CUF | Annual units | Capex vs baseline | What actually matters there |
|---|---|---|---|---|
| Rajasthan | 20.3–20.8% | 17.8–18.2 lakh | −2% to +2% | Best irradiation in the country and cheap land, but substation capacity in the solar belt is heavily subscribed. |
| Gujarat | 20.1–20.6% | 17.6–18.0 lakh | −2% to +2% | Strong policy record and good evacuation infrastructure. Land in Kutch is plentiful and far from load. |
| Madhya Pradesh | 19.6–20.3% | 17.2–17.8 lakh | 0% to +4% | Good irradiation, competitive land, longer logistics runs to site. |
| Maharashtra | 19.1–19.8% | 16.7–17.3 lakh | 0% to +5% | Large industrial demand for captive and group captive. Land cost varies enormously by district. |
| Karnataka | 19.3–19.8% | 16.9–17.3 lakh | 0% to +4% | Mature open access market. Evacuation in Tumakuru and Pavagada is congested. |
| Andhra Pradesh | 19.4–20.0% | 17.0–17.5 lakh | 0% to +4% | Good resource. Weigh the DISCOM payment record when the offtake is a state utility. |
| Telangana | 19.3–19.8% | 16.9–17.3 lakh | 0% to +4% | Strong resource with an active captive market around Hyderabad. |
| Tamil Nadu | 18.9–19.6% | 16.5–17.2 lakh | 0% to +5% | Two monsoons compress the annual figure. Large industrial load and an established group captive market. |
| Uttar Pradesh | 18.8–19.3% | 16.5–16.9 lakh | +2% to +6% | Lower irradiation and higher land pressure near load centres. |
| Punjab and Haryana | 18.8–19.3% | 16.5–16.9 lakh | +2% to +6% | Agricultural land dominates, so classification and conversion are the binding constraint. |
| Odisha and West Bengal | 18.8–19.0% | 16.5–16.6 lakh | +3% to +8% | Weakest resource of the major states, plus cyclone design loads on the east coast. |
| Kerala | 18.8–19.0% | 16.5–16.6 lakh | +5% to +10% | High rainfall, scarce flat land, and land cost that usually rules out ground mount entirely. |
CUF bands are indicative for fixed-tilt ground mount and vary within each state by district. Use satellite-derived or measured irradiation for a financial model. Capex variance excludes land, which differs by an order of magnitude between states and within them.
Approvals and timeline
Four months to build, twelve to eighteen to commission
Construction of a 1 MW plant takes four to six months. Getting to the point where construction can start takes considerably longer, and the approvals run in parallel with financing rather than after it. A promised commissioning date that assumes serial approvals is a date that will slip.
Grid connectivity
2 to 5 months
Feasibility and connectivity approval from the DISCOM or transmission utility. Spare bay capacity is finite and allocated by order of application.
Land conversion
1 to 6 months
Only where the classification requires it, and it varies by state. Confirm the requirement before buying, not after.
CEIG and consents
1 to 3 months
Electrical inspectorate approval is required before the plant can be charged. Pollution board consent runs alongside.
Construction
4 to 6 months
The predictable part, provided the soil report was done and the structure design is settled before mobilisation. How to contract it.
Where we fit, and where we do not
We are not selling you a 1 MW plant on this page
Blues Renewables works at MW scale as a subcontract EPC and balance-of-system contractor inside other developers' projects, and as a turnkey contractor at the rooftop and ground-mount sizes we have actually built. We do not own plants, bid tenders or hold power purchase agreements. What we will do, at no cost, is tell you whether the project you are considering is real.
What a feasibility read covers
- Whether the land classification supports a solar plant, and what conversion would involve.
- Route distance to the nearest substation with spare capacity, not straight-line distance.
- Whether the generation figure you have been given implies a CUF this state delivers.
- Whether the capex you have been quoted sits inside the band on this page, and which line is off if it does not.
What we will tell you to get elsewhere
- A bankable detailed project report, and a lender's engineer to certify it.
- Land aggregation, title diligence and conversion filings.
- A principal EPC contractor for a plant above the sizes we build.
- Tender bidding, if you plan to sell into a central or state auction.
Send us the district and the extent
That is enough for a first read. We will come back in writing on classification, substation distance, a defensible generation figure and whether the capex you have been quoted is sane. If the site does not work we will say so in the first call rather than the third.
If you already have a quotation in hand, send that too. Comparing it line by line against the table above takes us twenty minutes and occasionally saves people forty lakh.
1 MW solar plants, answered
How much does a 1 MW solar power plant cost in India in 2026?
A 1 MW solar power plant costs ₹3.8 to ₹4.3 crore to build turnkey in 2026, excluding land. That is ₹38 to ₹43 a watt for a fixed-tilt ground-mount plant using non-DCR modules on level terrain within a kilometre of the evacuation point. Domestic content cells, tracking structures, difficult soil or a distant substation each push it higher, and together they can take the same 1 MW past ₹5.5 crore.
What is the profit from a 1 MW solar power plant?
Between ₹47.6 lakh and ₹1.24 crore a year after operations and maintenance, depending entirely on what the unit is worth. At a DISCOM feed-in tariff of ₹3.20 a unit the net is about ₹47.6 lakh a year against a ₹4 crore plant, so roughly eight to nine years to recover the capital. Displacing your own industrial tariff at ₹7.80 a unit nets about ₹1.24 crore and recovers it in a little over three. The plant is identical in both cases.
How much land is required for a 1 MW solar power plant?
Four to five acres for a fixed-tilt plant. Only about a third of that sits under module; the rest is the row spacing that stops one row shading the next in December, plus internal roads, the inverter stations, the switchyard and boundary setbacks. Seasonal tilt needs 5 to 6 acres and single-axis trackers 6 to 8.
How many units does a 1 MW solar power plant produce?
About 16.5 to 17.2 lakh units a year in Tamil Nadu, or roughly 4,500 to 4,700 units on an average day, at a capacity utilisation factor of 18.9 to 19.6 per cent. Across India the band is 16.5 to 18.2 lakh units, at 18.8 to 20.8 per cent. In Rajasthan and Gujarat the same plant produces 17.9 to 18.2 lakh units because the irradiation is higher. Output falls about half a per cent a year as the modules degrade.
Is there a subsidy for a 1 MW solar power plant?
No. PM Surya Ghar is residential rooftop only and capped at ₹78,000, and it does not apply at MW scale. What can apply is accelerated depreciation for a taxable entity, PM-KUSUM Component A if the plant is 500 kW to 2 MW and farmer-owned, and state policy concessions such as electricity duty exemption. A financial model built on a rooftop subsidy at 1 MW is wrong before it starts.
What is the cost per MW of a solar power plant?
₹3.8 to ₹4.3 crore per MW at 1 MW, falling to about ₹3.4 crore per MW at 100 MW. The fall comes from spreading fixed costs — approvals, evacuation, mobilisation, monitoring — across more capacity, and from better equipment pricing at volume. Most of the benefit is captured by 10 MW; beyond that the curve flattens.
Does a 1 MW plant cost the same in every state?
Roughly, yes. Equipment is nationally priced and the difference between states is typically within five per cent, driven by civil works, logistics and local labour rather than by the plant itself. What genuinely differs by state is generation, because irradiation differs, and land price, which sits outside capex. A plant that costs the same in Rajasthan produces about nine per cent more than one in Tamil Nadu.
How long does it take to build a 1 MW solar plant?
Four to six months of construction, but 12 to 18 months from a secured site to commercial operation. Grid connectivity, electrical inspectorate approval, land use conversion and financial close run in parallel and are what actually set the commissioning date. Construction is rarely the reason a project is late.