



Tool · 2026 pricing
Solar Plant Cost Calculator
Set the capacity, the specification and the site. The calculator returns turnkey capex from 2026 EPC pricing bands, the land it needs, first-year generation for that state, the levelised cost of the unit, and what it returns at the tariff you enter. Every rate it uses is published below.
Last reviewed August 2026 · land, GST and financing excluded · all rates disclosed in section 02
Simple payback ignores debt service, degradation, tax and inverter replacement, and assumes every unit generated is sold or displaced at the tariff you entered. The returns model handles those properly.
Every rate it uses
The assumptions, published rather than hidden
A calculator that will not tell you its rates is a lead form. These are the numbers behind the output, current in August 2026, and they are the same ones used across the capacity pages in this cluster.
| Input | Rate used | Basis |
|---|---|---|
| Base capex, 1 MW | ₹4.05 cr per MW | Fixed tilt, non-DCR, level terrain, 1 km to the evacuation point, land excluded. |
| Capex at scale | ₹3.90 cr at 2 MW to ₹3.40 cr at 100 MW | Fixed costs spread over capacity; equipment stays a per-watt cost. |
| Below 1 MW | Up to ₹4.60 cr per MW at 250 kW | Mobilisation, approvals and the switchyard do not shrink with the plant. |
| DCR modules | +₹3.50 a watt | Domestic cell premium over imported cell, August 2026. |
| Seasonal tilt | +₹0.18 cr per MW, +20% land, +3.5% generation | Two manual tilt changes a year. |
| Single-axis tracker | +₹0.62 cr per MW, +55% land, +17% generation | Includes drives, controls and the additional O&M scope. |
| Rocky or undulating ground | +₹0.22 cr per MW | Piling difficulty, grading and drainage. |
| Black cotton soil | +₹0.30 cr per MW | Deeper foundations and concrete pedestals. |
| Evacuation line beyond 1 km | ₹9 lakh a km at 11 kV, ₹14 lakh at 33 kV, ₹38 lakh at 110 kV, ₹65 lakh at 220 kV | Overhead construction on plain terrain, way leave excluded. |
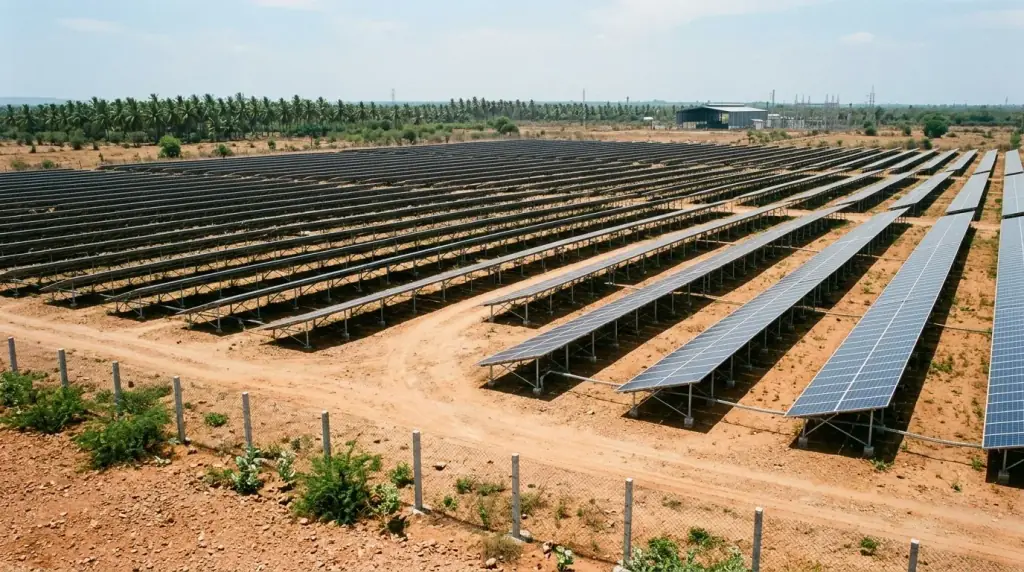
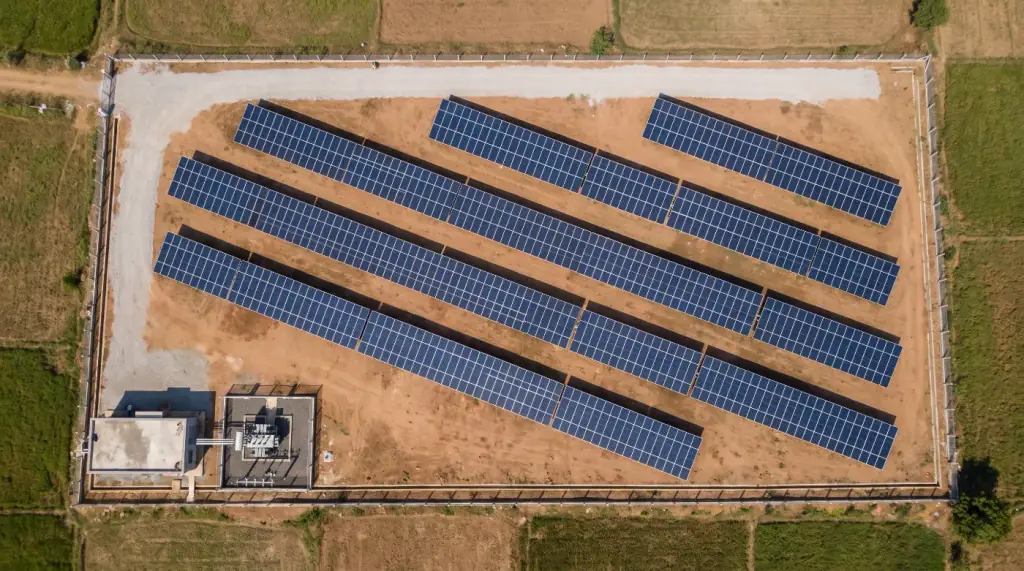
| Land | 4.5 acres per MW on fixed tilt | About a third under module; the rest is row spacing, roads and setbacks. |
| Generation | CUF 19.0% Tamil Nadu to 20.8% Rajasthan | Fixed tilt, no shading, cleaning maintained, inverter availability above 99%. |
| Operating cost | ₹5.5 lakh per MW a year | The O&M contract only. Full cost of ownership is ₹9 to ₹14 lakh per MW. |
| Levelised cost | Capex plus 25 years of O&M over 25 years of generation | Degradation 0.5% a year, O&M rising 5% a year, before financing. |
What it does not include
The ten to twenty per cent that turns capex into project cost
The output is the EPC scope. A lender funds a project cost, which is a larger number. Add these before you compare the calculator against a bank sanction.
Land or lease
Purchase or a 25-year registered lease across however many survey numbers it takes. Excluded here because it is not comparable between districts.
GST and duties
Currently a material line on modules and services. Whether it is a cost or a credit depends on your registration and output.
Interest during construction
Two to six per cent of project cost depending on the drawdown schedule and how long approvals take.
Reports and diligence
DPR, independent yield assessment, geotechnical investigation, legal opinion on title. ₹4 to ₹12 lakh at MW scale.
Conversion and way leave
Land use conversion charges and compensation along the line route, both of which vary by district and by who owns the land under the line.
Working capital
Four months of receivables at a minimum. A plant that is generating but not yet paid still has to pay for security and cleaning.
How to use the output
Four questions the calculator cannot answer
Use it to test whether a quotation is sane and whether a site is worth pursuing. Then answer these four before spending anything.
01
Does the substation have room
A spare bay and spare transformation capacity, in writing from the DISCOM. A substation two kilometres away that is full is worse than one six kilometres away with a bay free.
02
What is under the soil
A geotechnical report changes the civil and structure lines by lakhs per MW. Every quotation before the soil report is provisional, including this one.
03
Who is contractually buying
A signed offtake at a stated tariff. Without it there is no financing and the tariff you typed above is a hope, not an input.
04
Can the title be secured
Registered, assignable, unencumbered, with no public path through the parcel. This stops more MW-scale projects than money does.
Where we fit, and where we do not
What to do with the number you just got
Blues Renewables works at MW scale as a subcontract EPC and balance-of-system contractor inside other developer projects, and as a turnkey contractor at the rooftop and ground-mount sizes we have built. We do not own plants, bid tenders or hold power purchase agreements. If the calculator disagrees with a quotation you are holding, send us both.
What a feasibility read covers
- A line-by-line comparison of your quotation against the bands used here, naming which line is off.
- Route distance to the nearest substation with spare capacity, rather than straight-line distance.
- Whether the generation figure you have been given implies a CUF that state actually delivers.
- Whether the land extent and shape can carry the capacity without wasting rows.
What we will tell you to get elsewhere
- A bankable detailed project report and a certified financial model.
- An independent energy yield assessment with P50 and P90.
- Land aggregation, title diligence and conversion filings.
- Principal EPC responsibility above the sizes we build.
Send us the configuration and the quotation
Tell us the district, the extent, the capacity and what you have been quoted. We will come back in writing on whether the assumptions hold and where the risk sits. No cost, and no obligation to use us for anything.
The most common gap between a calculator and a real quotation is the evacuation package, and the second is what the soil report has not been done yet.
Using the calculator
How accurate is a solar plant cost calculator?
Close enough to judge a quotation and nowhere near enough to raise money on. This calculator works from 2026 EPC pricing bands and standard per-MW rates, so the capex it returns should be within about ten per cent of a competent quotation for a straightforward site. What it cannot know is your soil, your title, whether the substation has a spare bay, and what your offtaker will actually pay. Those four things move a project more than any rate in the table below.
What does the calculator exclude?
Land cost or lease, GST, interest during construction, the fee for a detailed project report and an independent yield assessment, land use conversion charges, and the way leave compensation on the evacuation line. Together those can add ten to twenty per cent to what you actually spend, so the number here is the EPC scope rather than the project cost a lender will see.
Why does cost per MW fall as capacity rises?
Because a fixed set of costs does not scale. Approvals, the project report, the connectivity application, site establishment, the monitoring head end and contractor mobilisation are close to identical at 1 MW and at 5 MW. Modules, structure, cable and piling are per-watt costs that scale almost exactly. That is why per-MW cost falls from about ₹4.05 crore at 1 MW to about ₹3.40 crore at 100 MW rather than halving.
How much land does the calculator assume?
Four and a half acres per MW on fixed tilt, rising twenty per cent for seasonal tilt and about fifty-five per cent for single-axis trackers, because rows have to be spaced further apart to avoid shading each other. Only about a third of the area carries module; the rest is row spacing, internal roads, inverter stations, the switchyard and boundary setbacks.
Why does the generation figure change when I change state?
Because irradiation does. The same plant delivers a capacity utilisation factor of about 18.9 to 19.6 per cent in Tamil Nadu, 19.1 to 20.0 in Maharashtra and Andhra Pradesh, and 20.1 to 20.8 in Gujarat and Rajasthan. Nine per cent more generation from identical equipment is why the same capex produces very different returns in different states, and why land price alone should not decide the site.
Can I use this output in a project report?
As a first cut and a sanity check, yes. As the basis of a DPR a lender will fund, no. A bankable report needs a site-specific yield assessment giving P50 and P90 numbers, a real bill of quantities, the DISCOM connectivity position in writing, and land documents. This calculator is what you use before commissioning any of that, to decide whether the project is worth the effort.